- KDDI HOME
 Corporate Information
  Investor Relations
  IR Documents
  Integrated Report
  Selected Pages of Integrated Report (2014)
  Performance Analysis for the Fiscal Year Ended March 31, 2014
Performance Analysis for the Fiscal Year Ended March 31, 2014
Analysis of Statements of Income
Operating Revenues
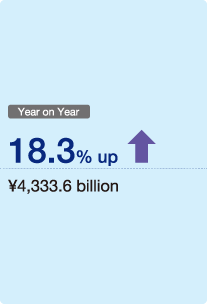
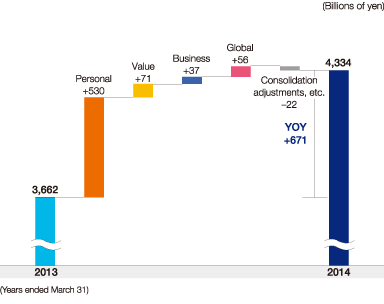
In the Personal Services segment, which accounts for more than 70% of consolidated operating revenues, mobile communications revenues grew thanks to a steady rise in the smartphone penetration rate, and revenues from handset sales expanded. These factors, plus the inclusion of J:COM into the scope of consolidation, prompted an 18.3% year-on-year increase in consolidated operating revenues, to ¥4,333.6 billion.
Operating Income
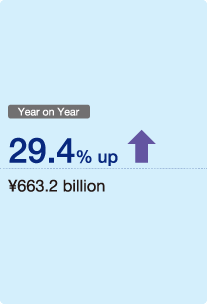
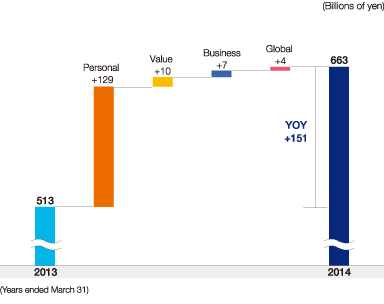
Consolidated operating income rose 29.4%, to ¥663.2 billion. This was primarily due to sharply higher revenues from the Personal Services segment absorbing an increase in sales commissions in the face of increasingly fierce competition, higher handset procurement costs in tandem with a rise in unit sales of smartphones, and expenses related to the consolidation of J:COM.
Net Income
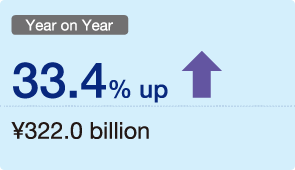
Net income was up 33.4% year on year, to ¥322.0 billion. In addition to higher operating income, extraordinary losses declined significantly. In the previous fiscal year, extraordinary losses totaled ¥104.9 billion, due to the posting of impairment and retirement losses stemming from the discontinued use of former 800MHz frequency facilities. During the year under review, extraordinary losses were ¥50.3 billion, stemming from losses on step acquisition of J:COM's shares.
Dividends per Share *
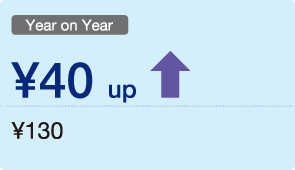
We awarded full-year cash dividends per share of ¥130, up ¥40 year on year, amounting to a consolidated dividend payout ratio of 32.6%. Our dividend policy is to maintain the consolidated dividend payout ratio at a level above 30% while taking into consideration the investments necessary to achieve growth and ensure stable business operations, and we plan to continue raising dividends through synergy between a higher consolidated dividend payout ratio and increasing earnings per share in line with increased operating income.
Analysis of Balance Sheets
Total Assets
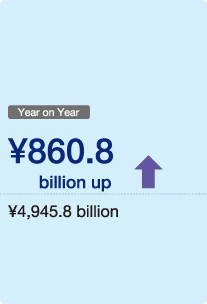
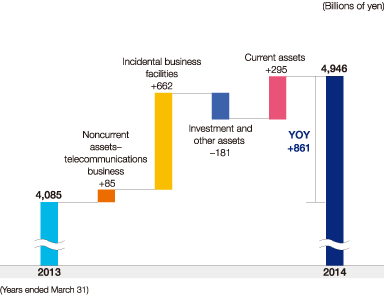
The consolidation of J:COM prompted incidental business facilities to increase, causing total assets to rise ¥860.8 billion, to ¥4,945.8 billion.
Total Net Assets
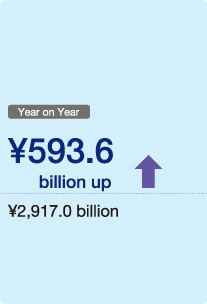
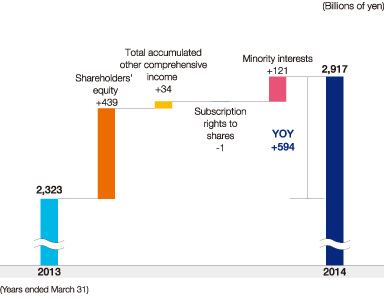
Shareholders' equity expanded in line with an increase in retained earnings. In addition, the conversion of convertible bond-type bonds with subscription rights to shares delivered a major boost to shareholders' equity through the allocation of Company shares, and minority interests increased. As a result, net assets expanded ¥593.6 billion year on year.
Interest-Bearing Debt
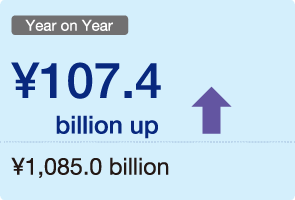
Completion of the conversion of convertible bond-type bonds with subscription rights to shares brought down interest-bearing debt. More than compensating for this decrease was the combination of funding through longterm loans payable and the increase in debt related to the J:COM consolidation. Interest-bearing debt consequently rose ¥107.4 billion, to ¥1,085.0 billion.
D/E Ratio
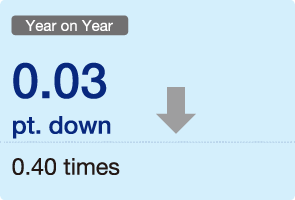
We raised funds through longterm loans payable, and the J:COM consolidation led to an increase in interest-bearing debt. At the same time, however, net assets expanded due to factors such as the rise in retained earnings and a decline in treasury stock. Accordingly, the D/E ratio decreased 0.03 percentage point.
Analysis of Capital Expenditures and Cash Flows
Capital Expenditures
Consolidated capital expenditures rose ¥104.8 billion compared with the fiscal year ended March 31, 2013, to ¥571.8 billion.
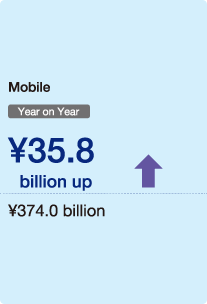
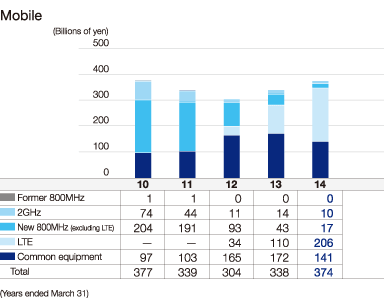
Capital expenditures in the mobile business were up ¥35.8 billion, to ¥374.0 billion, as we made aggressive LTE-related investments—chiefly for the construction of base stations—to boost our LTE area coverage in the 800MHz band to 99% by March 31, 2014.
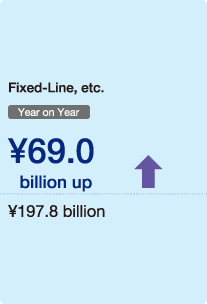
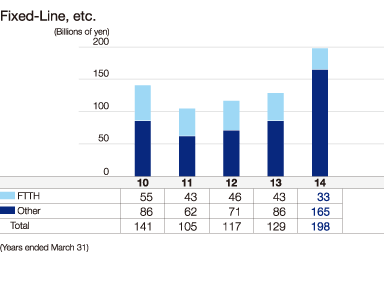
In the fixed-line business, capital expenditures rose ¥69.0 billion year on year, to ¥197.8 billion. Reasons for the increase included rises related to the J:COM consolidation and domestic and overseas data center expansion.
Cash Flows
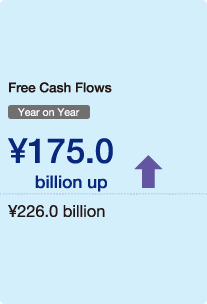
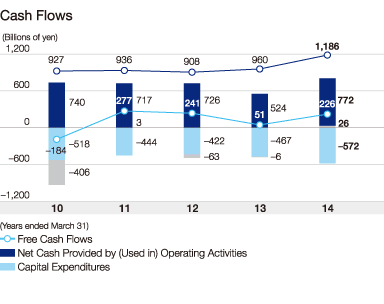
Net cash provided by operating activities came to ¥772.2 billion, ¥248.3 billion more than in the previous year, affected by higher income before income taxes and minority interests and a smaller increase in installment sales receivables stemming from smartphone sales. Net cash used in investing activities totaled ¥546.3 billion, up ¥73.3 billion, mainly due to the J:COM consolidation. Free cash flows, the total of operating and investing cash flows, therefore amounted to ¥226.0 billion, up ¥175.0 billion.
- For more information
- Other IR Information
- Recommended Contents
-


